Quantifying the Returns of ESG Investing: An Empirical Analysis with Six ESG Metrics
Journal of Portfolio Management by Florian BergAndrew W. LoRoberto RigobonManish SinghRuixun Zhang (2024)
RESEARCH


ABSTRACT
Within the contemporary context of environmental, social, and governance (ESG) investing principles, the authors explore the risk–reward characteristics of portfolios in the United States, Europe, and Japan constructed using the foundational tenets of Markowitz’s modern portfolio theory with data from six major ESG rating agencies. They document statistically significant excess returns in ESG portfolios from 2014 to 2020 in the United States and Japan. They propose several statistical and voting-based methods to aggregate individual ESG ratings, the latter based on the theory of social choice. They find that aggregating individual ESG ratings improves portfolio performance. In addition, the authors find that a portfolio based on Treynor–Black weights further improves the performance of ESG portfolios. Overall, these results suggest that significant signals in ESG rating scores can enhance portfolio construction despite their noisy nature.
Research Objective
ESG ratings are divergent among rating agencies, how do we optimally utilize inconsistent ESG ratings to construct portfolios/improve investment performance?
Methodology
Compare individual stock's alphas with ESG scores
Construct ESG portfolios sorted by various ESG scores or aggregation of ESG scores based on specific methods, for U.S., Europe, and Japan stocks
Quantify excess returns of each constructed portfolio based on factor models
Data
ESG scores from 6 rating agencies: MSCI, S&P Global, ISS, Moody's ESG solutions, Reprisk, and TruValueLabs
Need a firm to have scores from all 6 agencies, leaving 633 firms in U.S., 547 in Europe, and 274 in Japan.
Period: 2014 - 2020
Findings
Aggregating ESG ratings from various agencies improves portfolio performance, 6% in U.S. using Mahalanobis distance, 6% in U.S. and 9% in Japan using Singular Transferable Voting. Other methods like PCA, equal weighted average, optimized ESG score are used as well.
Positive relation btw ESG scores and excess returns in U.S. and Japan in 2014-2020 found, due to inflows of ESG funds to high ESG stocks.
E pillar is most pronounced in portfolio construction for excess returns in U.S. and Japan.
Varying/Mixed investment performance measured by excess returns/alphas from different rating sources.
Questions/Concerns
How do regulatory shocks affect portfolio performance?
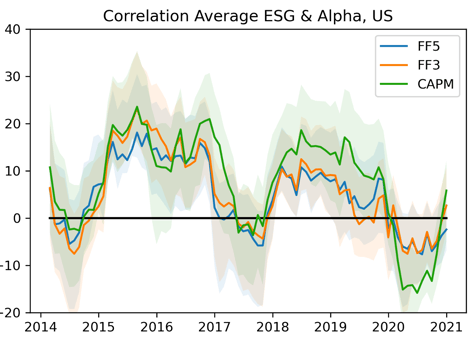
Figure below shows a steep drop in correlation btw ESG and alphas in late 2016, when Trump surprisingly won 2016 election and another cliff after Covid outbreak. Why?
No empirical evidence suggests Findings 2. Useful and sufficient empirical numbers but lack of explanation and connection with existing theories.
Should ESG be added to the factor model as a systematic risk?